

Key Takeaways
- The global mobile app market is worth around $330 billion in 2026 and is on track to pass $1 trillion within the next decade.
- Users spent 5.3 trillion hours in apps in 2025, but download growth has stalled. Engagement now matters more than installs.
- In-app purchase revenue hit $167 billion in 2025, and non-gaming apps out-earned games for the first time.
- Google Play and the Apple App Store each hold about 2.35 million apps, but iOS users spend far more per head.
- Generative AI is the fastest-growing category, projected to top $10 billion in consumer spending in 2026.
- The average app keeps only about 6% of users by Day 30, making retention the real test of success.
- Asia-Pacific leads on size and growth, while the USA leads on revenue.
7.58 billion. This is the estimated number of smartphone users in 2026.
This number signals the growing adoption of smartphones worldwide, and it creates a real opportunity for businesses like yours to launch applications that can serve millions of users.
As a leading mobile app development company, Helpful Insights has worked with businesses of all sizes, from startups, mid-sized, to enterprises. We have seen firsthand how much a well-built app can do for a business, and the statistics in this blog will help you see it too.
In this blog, we have compiled a list of the mobile app statistics 2026 from market size, revenue, usage, and more.
So, let’s get started.
Mobile App Size Statistics 2026
Mobile apps are one of the largest and fastest-growing digital markets in the world, which is growing continuously in 2026 and beyond.
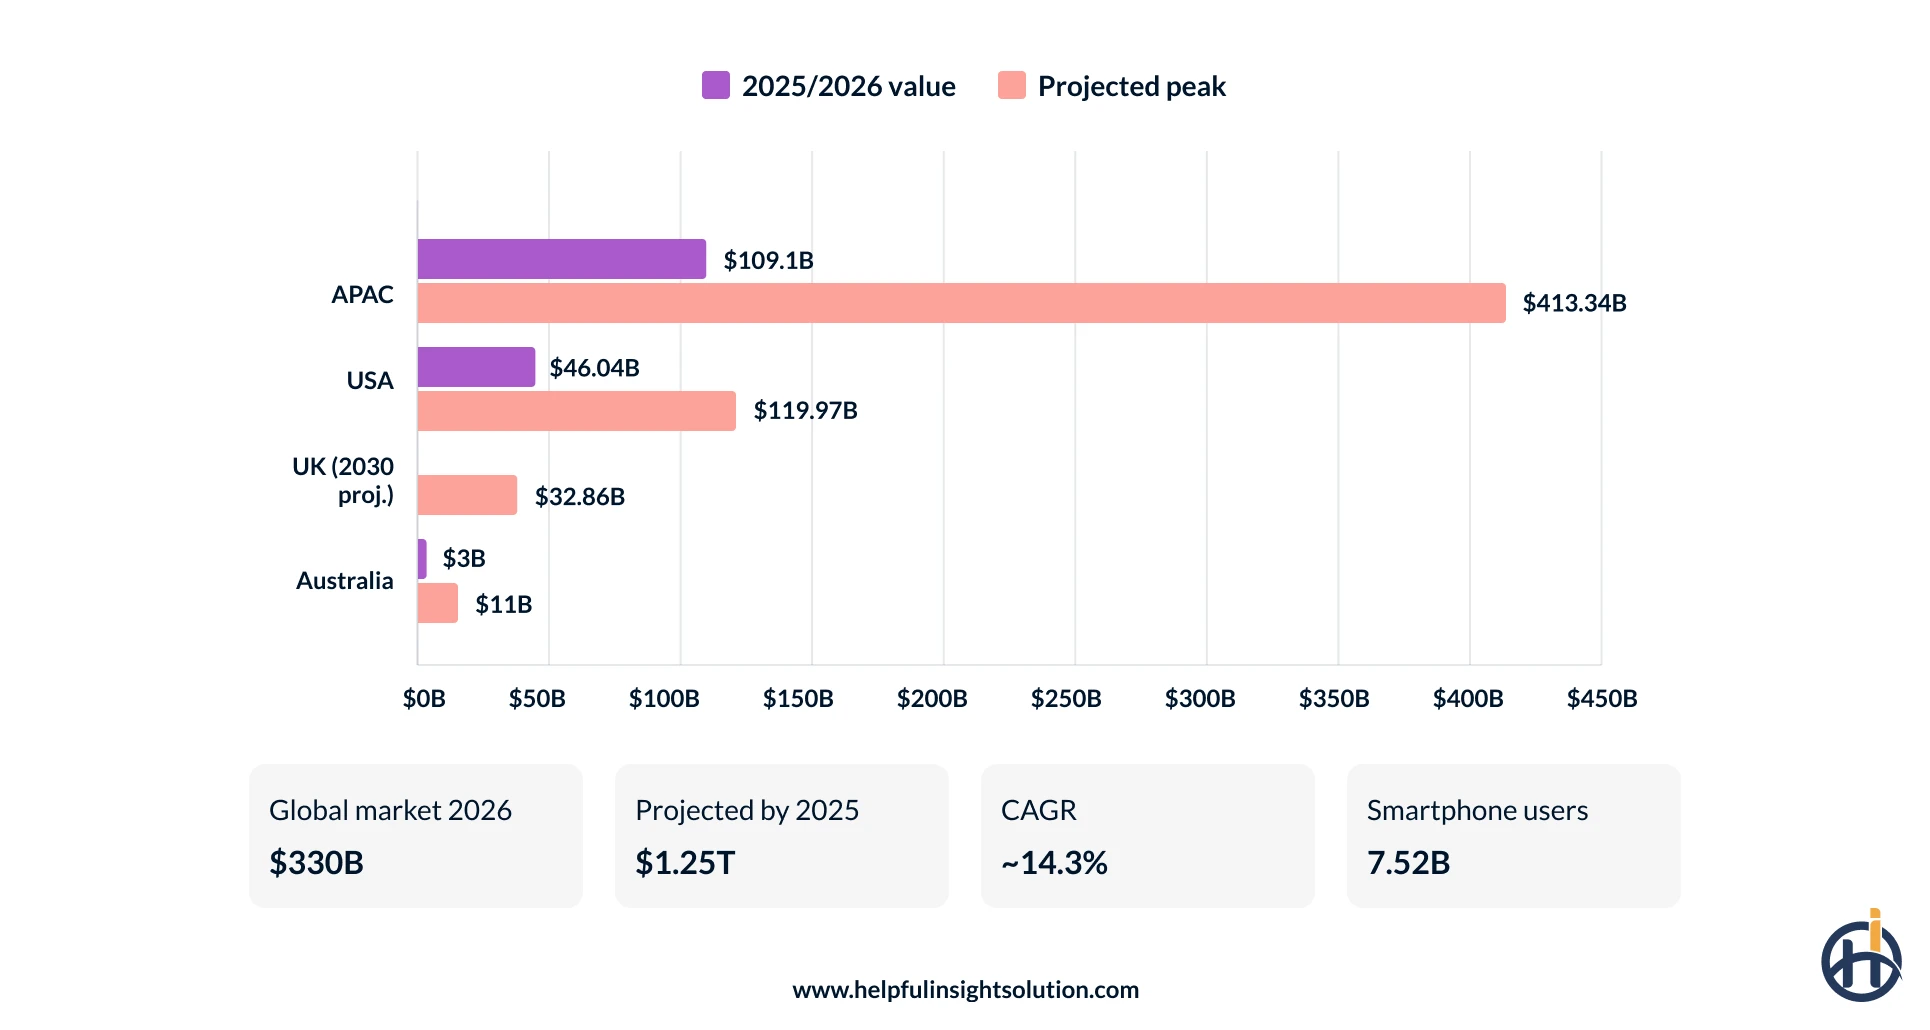
The global mobile app market size was valued at USD 298 billion, projected to reach USD 330 billion by the end of 2026, with forecasts pointing past the trillion-dollar mark within the next decade. (Source: Fortune Business Insights)
The market is adding tens of billions in value every single year, driven by more smartphones, cheaper data, and people who now run their daily lives through apps.
Mobile App Market Size in Asia-Pacific
Asia-Pacific is the largest and fastest-growing region in the global mobile app market holding around 33% of the worldwide market in 2025 and projected to remain the primary growth engine through 2035. (Source: Precedence Research)
The growth of mobile app development in the Asia-Pacific region is often attributed to increasing young, smartphone-first people who are actively using apps in their day-to-day lives.
The Asia-Pacific mobile app market was valued at around USD 109.10 billion in 2025 and is projected to reach roughly USD 413.34 billion by 2035, with a CAGR of 14.25%. Gaming has been the single largest category.
The three biggest app markets in Asia are:
- China is the largest mobile app market in Asia by revenue, accounting for around 14.6% of the global mobile application market in 2024, and its revenue is projected to reach roughly USD 89.6 billion by 2030, growing at a CAGR of about 16.3% from 2025 to 2030. (Source: Grand View Research)
- India is the fastest-growing app market in Asia-Pacific and the world’s number one country for app downloads. Its app revenue is projected to reach around USD 27.7 billion by 2030, growing at a CAGR of about 17.8%. (Source: Grand View Research)
- Japan remains one of the highest-value app markets in the region, with a mature, high-spending user base where iOS leads on revenue and premium subscriptions and gaming drive most of the consumer spend. (Source: Grand View Research)
Mobile App Market Size in the USA
The USA is the world’s highest-value mobile app market, and it is expected to hold its leadership through 2030. (Source: Grand View Research)
The USA market has been the early adopter of the emerging technologies, with high smartphone penetration and a user base that spends more freely on apps and subscriptions than almost any other.
The USA mobile app market was valued at 46.04 billion USD in 2025, projected to reach USD 119.97 billion by 2035, with a CAGR of 10%. Gaming was the largest category, while health and wellness applications ranked among the fastest-growing segments. (Source: Market Research Future)
Also, the USA alone made up 22.9% of the global mobile application market in 2024, which is the single largest share in the country. (Source: Grand View Research)
With spending and adoption at this level, the USA remains one of the most rewarding markets to launch in, and a mobile app development company in New York, USA, can help you turn that opportunity into a product built for these users.
Mobile App Market Size in the UK
The United Kingdom (UK) is one of the largest mobile app markets in Europe, and is expected to lead the region in terms of revenue by 2030. (Source: Grand View Research)
The UK mobile app market size is expected to reach USD 32.86 billion by 2030, with a CAGR of 15.4%. The Apple App Store is the leading mobile app marketplace in terms of revenue in 2024, while the Google Play Store is also expected to grow by 2030. (Source: Grand View Research)
The UK contributed for 5.6% of global mobile application revenue in 2024, positioning it as one of the top contributors outside the USA and Asia Pacific.
Mobile App Market Size in Australia
Australia is a mature, high-spending app market, with smartphone penetration expected to reach around 87% by 2026. (Source: Grand View Research)
The high smartphone adoption and consumer spending power drive the growth of the market.
The Australian app market generated USD 3 billion in revenue in 2024, a 15.3% increase over the previous year, and total app market revenue is projected to exceed USD 11 billion by 2027. (Source: Business of Apps)
Mobile App Market Size in the UAE
The UAE is the leading mobile app market in the Middle East and is projected to lead the region in revenue by 2030. (Source: Grand View Research)
The growth is the result of the near-universal smartphone ownership, high disposable incomes, and a government that has pushed digital adoption across banking, government services, and everyday commerce, giving apps a central place in daily life across the Gulf. It is no surprise that businesses across the region increasingly work with a mobile app development company in Dubai to reach these high-value users.
In terms of growth, the UAE mobile app market is expected to expand at a CAGR of 10.3% from 2025 to 2030. The Apple App Store was the largest store type by revenue in 2024, reflecting the country’s premium-device user base, while the Google Play Store is set to grow the fastest over the same period. (Source: Grand View Research)
In terms of revenue, the UAE made up around 0.5% of the global mobile application market in 2024, a modest global share that belies its strength as the highest-value app market in the Middle East and Africa region. (Source: Grand View Research)
Mobile App Usage Statistics
Total time spent across mobile apps reached 5.3 trillion hours in 2025, up 3.8% year over year, the highest level on record. That works out to more than 600 hours for every person on earth, a clear sign of how central apps have become to daily life. (Source: Sensor Tower)
The market has also matured. Download growth has slowed while time spent and spending keep rising, which means the competition is no longer about acquiring users but about holding their attention.
Average Time Spent on Mobile Apps Per Day
The average user spent roughly 3.6 hours per day in mobile apps in 2025, a figure that has held steady as smartphone markets reach saturation.
Social media apps account for the single largest share of that time, with users worldwide spending close to 2.5 trillion hours in social apps over the year, more than 90 minutes per person per day, and far ahead of any other category. (Source: Sensor Tower)
How Many Apps Does the Average Person Use?
The average user engaged with around 34 apps per month in 2025, up 5.4% over the prior year, but returned to only about 10 of them on any single day. (Source: Sensor Tower)
Engagement has become more selective, with users concentrating their time on a shrinking core of apps rather than spreading it across everything they have installed. This means the real competition is not every app on the phone, but the handful that earn a daily opening.
App Download Statistics
Global app download statistics sit in the range of 107 to 149 billion per year.
According to Sensor Tower, 149 billion apps were downloaded in 2025, 0.8% increase compared to the previous year.
Appfigures, on the other side, puts the total lower at 106.9 billion and reports a 2.7% decline, the fifth year of falling installs. (Source: TechCrunch)
Both statistics might have different numbers to reveal, but one thing is consistent, the download growth has been steady, and consumer spending is increasing.
How Many Apps are Downloaded Per Day?
On average, 280,000 installs per minute, the world downloads roughly 408 million apps every single day. (Source: Sensor Tower)
The number of app downloads per day is split unevenly between the App Store and the Google Play Store. Google Play Store is expected to account for around 143 billion downloads in 2026 against roughly 38 billion from the Apple App Store. (Source: Statista)
App Downloads by Country
India leads the world in app installs by a huge margin, recording around 25.5 billion downloads in 2025, ahead of the United States and Brazil. (Source: Sensor Tower)
The United States saw around 10 billion downloads, a 4.2% fall from the previous year, even as US consumer spending on apps rose to $55.5 billion. (Source: Appfigures via Dataconomy)
Indeed, India has the highest app downloads in the world, but when it comes to revenue per user, the USA leads the world.
App Store Statistics: Apple App Store vs Google Play Store
When it comes to mobile app development platforms, Android and iOS are the two biggest platforms.
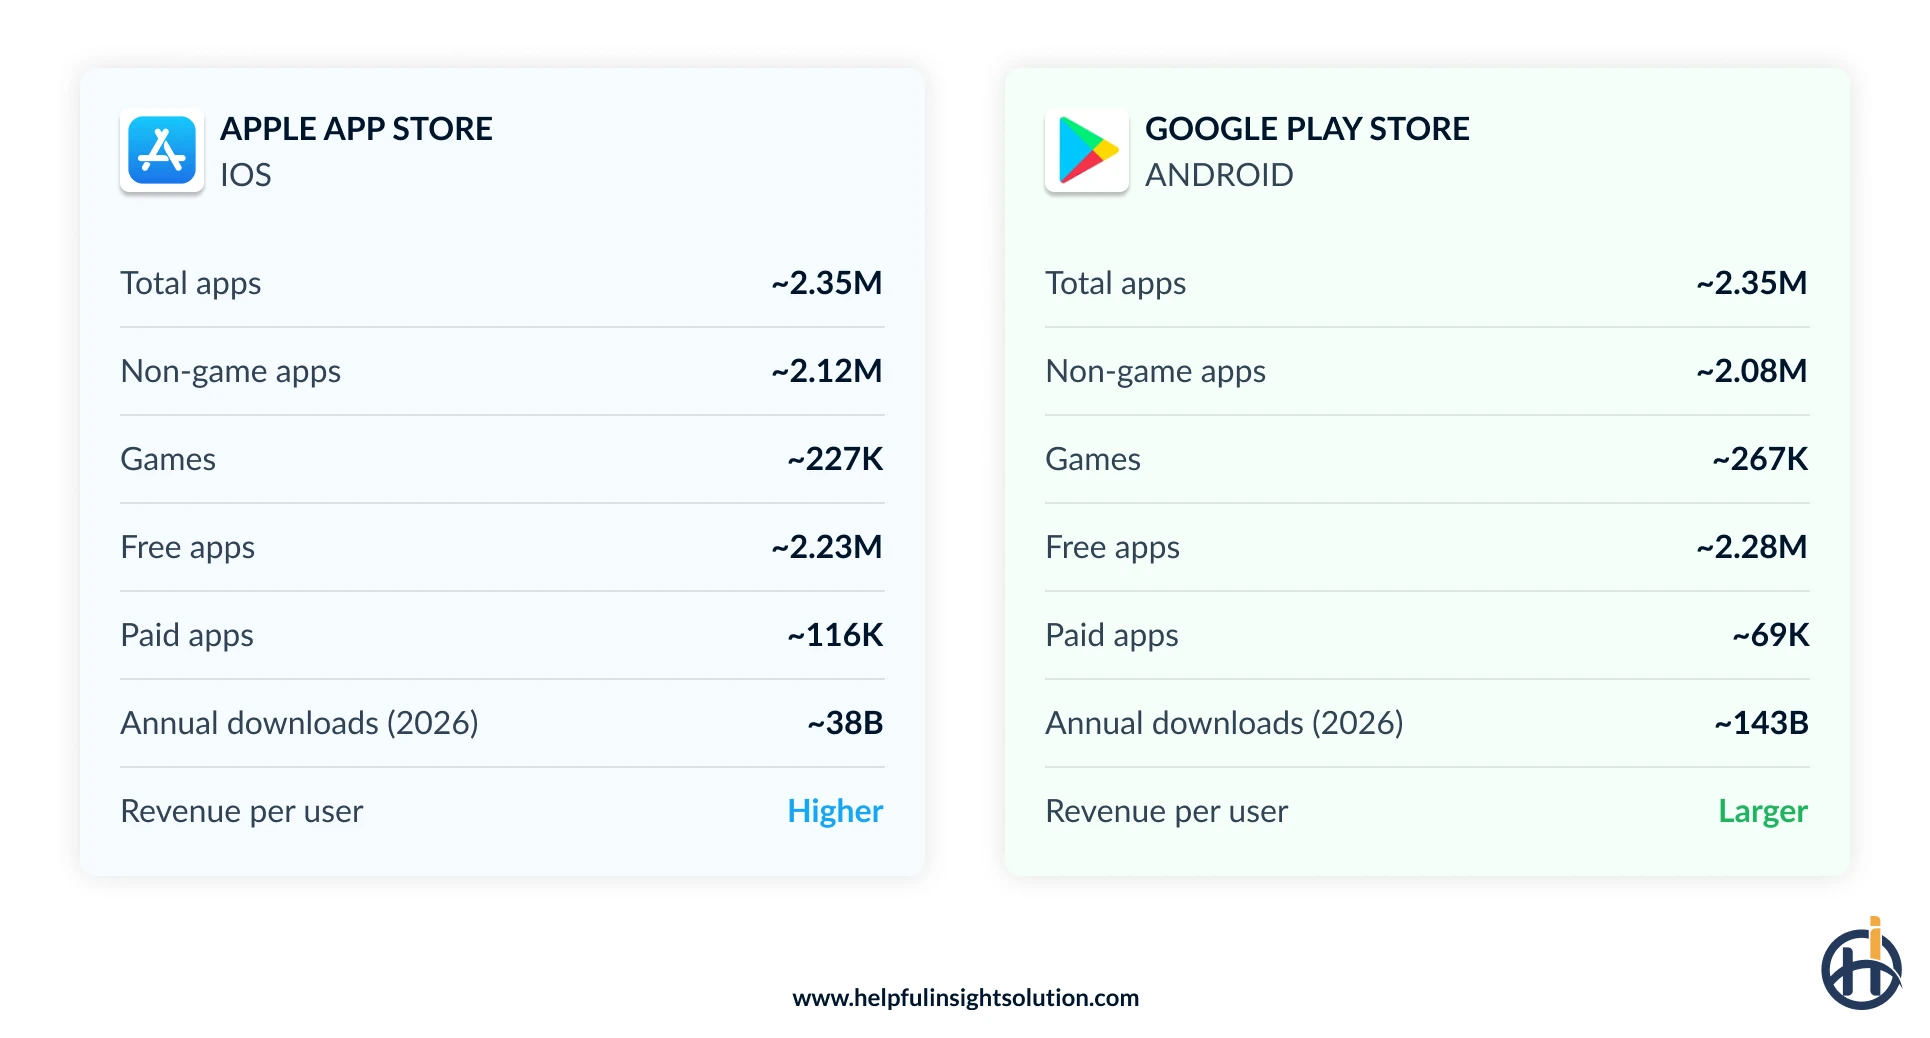
As of mid 2026, the Google Play Store has around 2.35 million apps, while the Apple App Store has around 2.35 million as well, putting them almost level after years of Google Play holding a clear lead.
The number of mobile apps on Android and iOS is increasing daily as new applications are being launched.
| Metric | Google Play | Apple App Store |
| Total apps | ~2.35 million | ~2.35 million |
| Non-game apps | ~2.09 million | ~2.12 million |
| Games | ~267,000 | ~227,000 |
| Free apps | ~2.28 million | ~2.23 million |
| Paid apps | ~69,000 | ~116,000 |
Source: 42matters
How Many Mobile Apps are There in 2026?
Counting both major stores together, there are roughly 4.7 million apps available to download in 2026. Google Play holds about 2.35 million, and the Apple App Store holds about 2.35 million. (Source: 42matters)
Number of Apps in the Apple App Store
The Apple App Store has around 2.35 million apps, segmented into roughly 2.13 million non-game apps and 227,000 games.
The major share of the mobile applications on the App Store is free, around 2.24 million, while 116,000 applications are paid ones. (Source: 42matters)
After several years of decline, app submissions rebounded firmly in 2025, with Apple publishing around 557,000 new app releases, a 24% rise and its biggest wave of new apps since 2016. (Source: Appfigures)
Number of Apps in Google Play Store
Google Play Store has around 2.35 million apps to offer, of which approximately 2.08 million are non-game, and 266,000 are games. (Source: 42matters)
Google Play Store has 2.28 million free applications, and 69,000 are paid applications as of mid-2026. (Source: 42matters)
On downloads, Statista projects Google Play will reach around 143 billion installs in 2026, well ahead of the App Store’s projected 38 billion, reflecting Android’s far larger global user base.
Mobile App Revenue Statistics 2026
The mobile app revenue in 2026 is increasing each year, even when the number of downloads remains steady.
Users’ spending on apps and games reached $166.8 billion in 2025, an 11.1% year-over-year rise, while in-app purchase revenue hit $167 billion, up 10.6%. (Source: Business of Apps, Sensor Tower)
Non-Gaming Apps Overtake Games Revenue
It is the first time that non-gaming mobile applications have surpassed game applications in app purchase spending, generating around $85.6 billion against roughly $81.8 billion for games. (Source: Sensor Tower via eMarketer)
Non-game applications revenue also grew 21% on the year, nearly three times the level of five years earlier. (Source: Sensor Tower)
For years, games were the leading mobile app revenue driver. This shift means non-game applications across categories like productivity, health, streaming, and generative AI are now where much of the growth sits.
iOS vs Android Mobile App Revenue 2026
Most subscription applications are generating the majority of their revenue from iOS, with more than 67% of apps in every region making at least 80% of their revenue from Apple users. (Source: RevenueCat)
Indeed, Android OS has a far larger user base, but iOS users are spending more per head.
App Monetization Statistics
Mobile apps make money through three main channels: in-app advertising, in-app purchases, and subscriptions.
| Channel | 2025 figure | Trend |
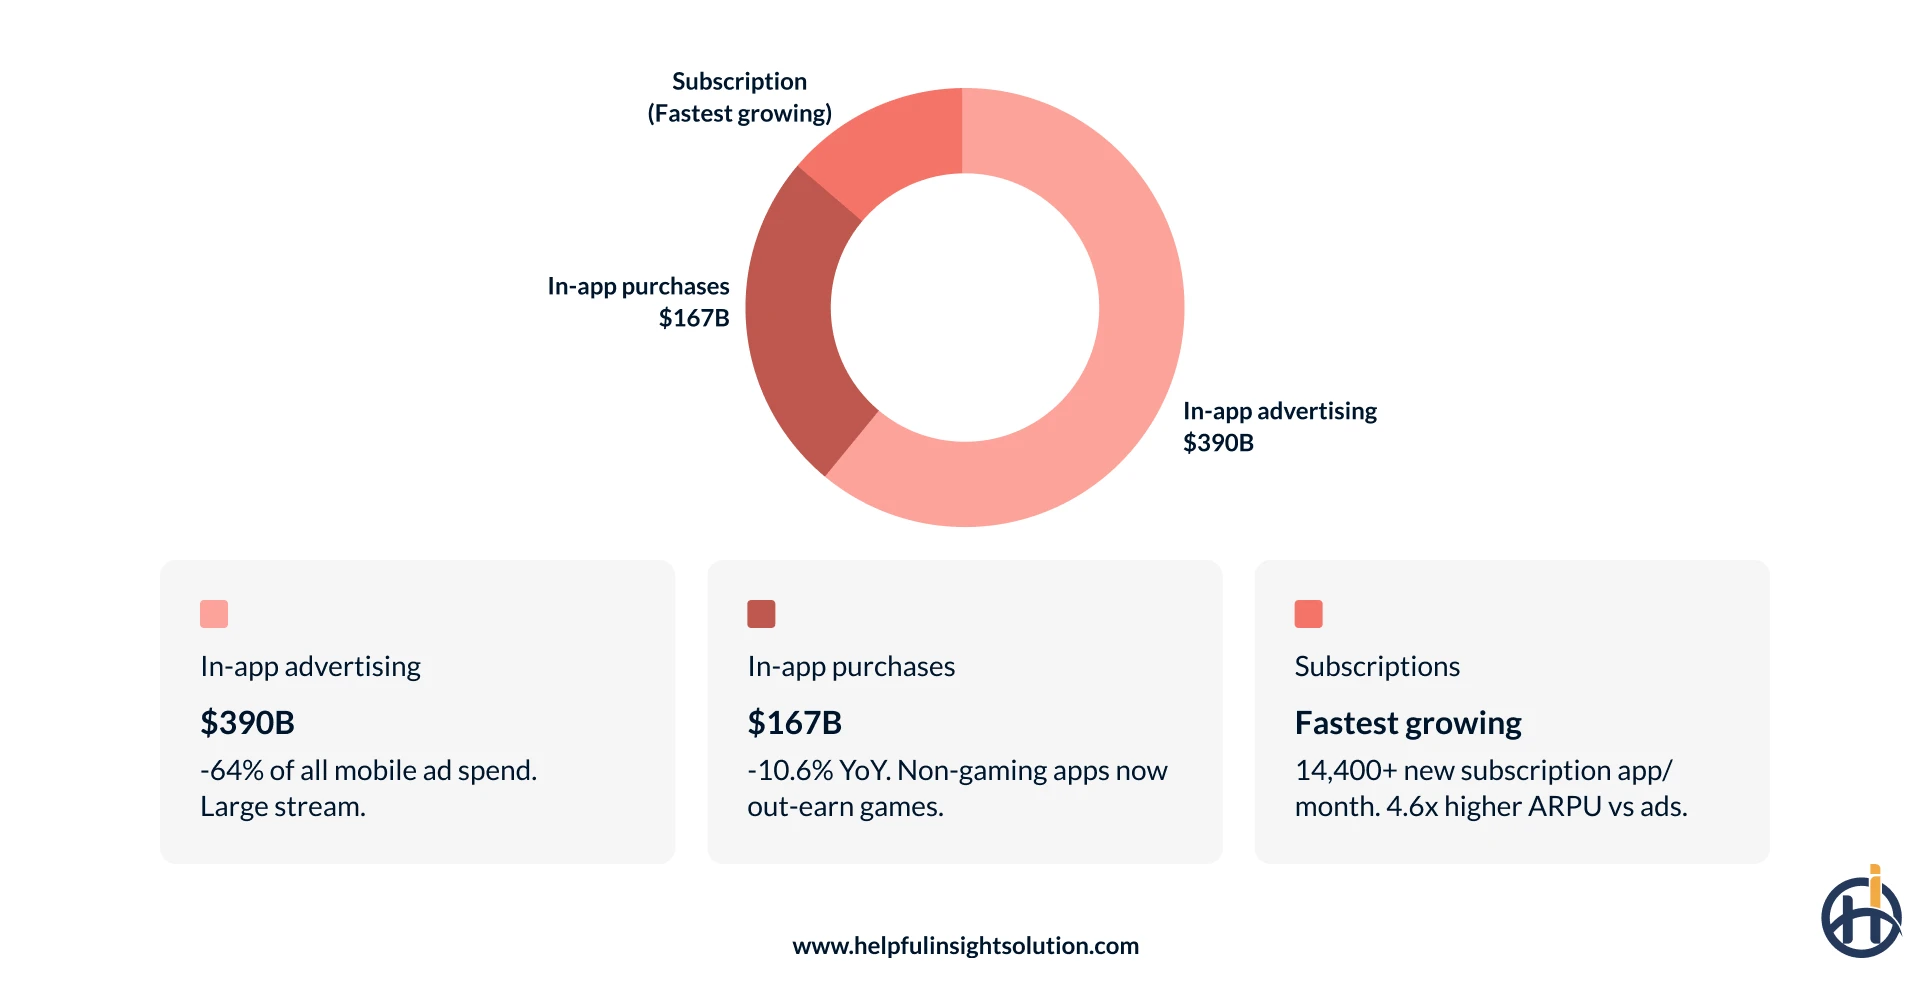
| In-app advertising | ~$390 billion global ad spend | Largest revenue stream; ~64% of all mobile ad spend (Publift) |
| In-app purchases (IAP) | $167 billion, up 10.6% YoY | Non-game apps now out-earn games (Sensor Tower) |
| Subscriptions | Fastest-growing model; 14,700+ new subscription apps launching per month | iOS drives the majority of subscription revenue (RevenueCat) |
Two patterns stand out for any business planning how an app will earn:
- Subscriptions outperform ads per user: Apps using a subscription model generate around 4.6 times higher average revenue per user than ad-only apps, which is why so many categories have moved to recurring billing. (Source: SQ Magazine)
- Hybrid models win: More than 60% of top-grossing apps now combine two or more revenue streams, typically a free, ad-supported tier alongside subscriptions and in-app purchases, rather than relying on any single source. (Source: SQ Magazine)
Mobile App Engagement & Retention Statistics
In 2026 and beyond that, one thing will remain steady: getting mobile app downloads is no longer a difficult task, but keeping the users is.
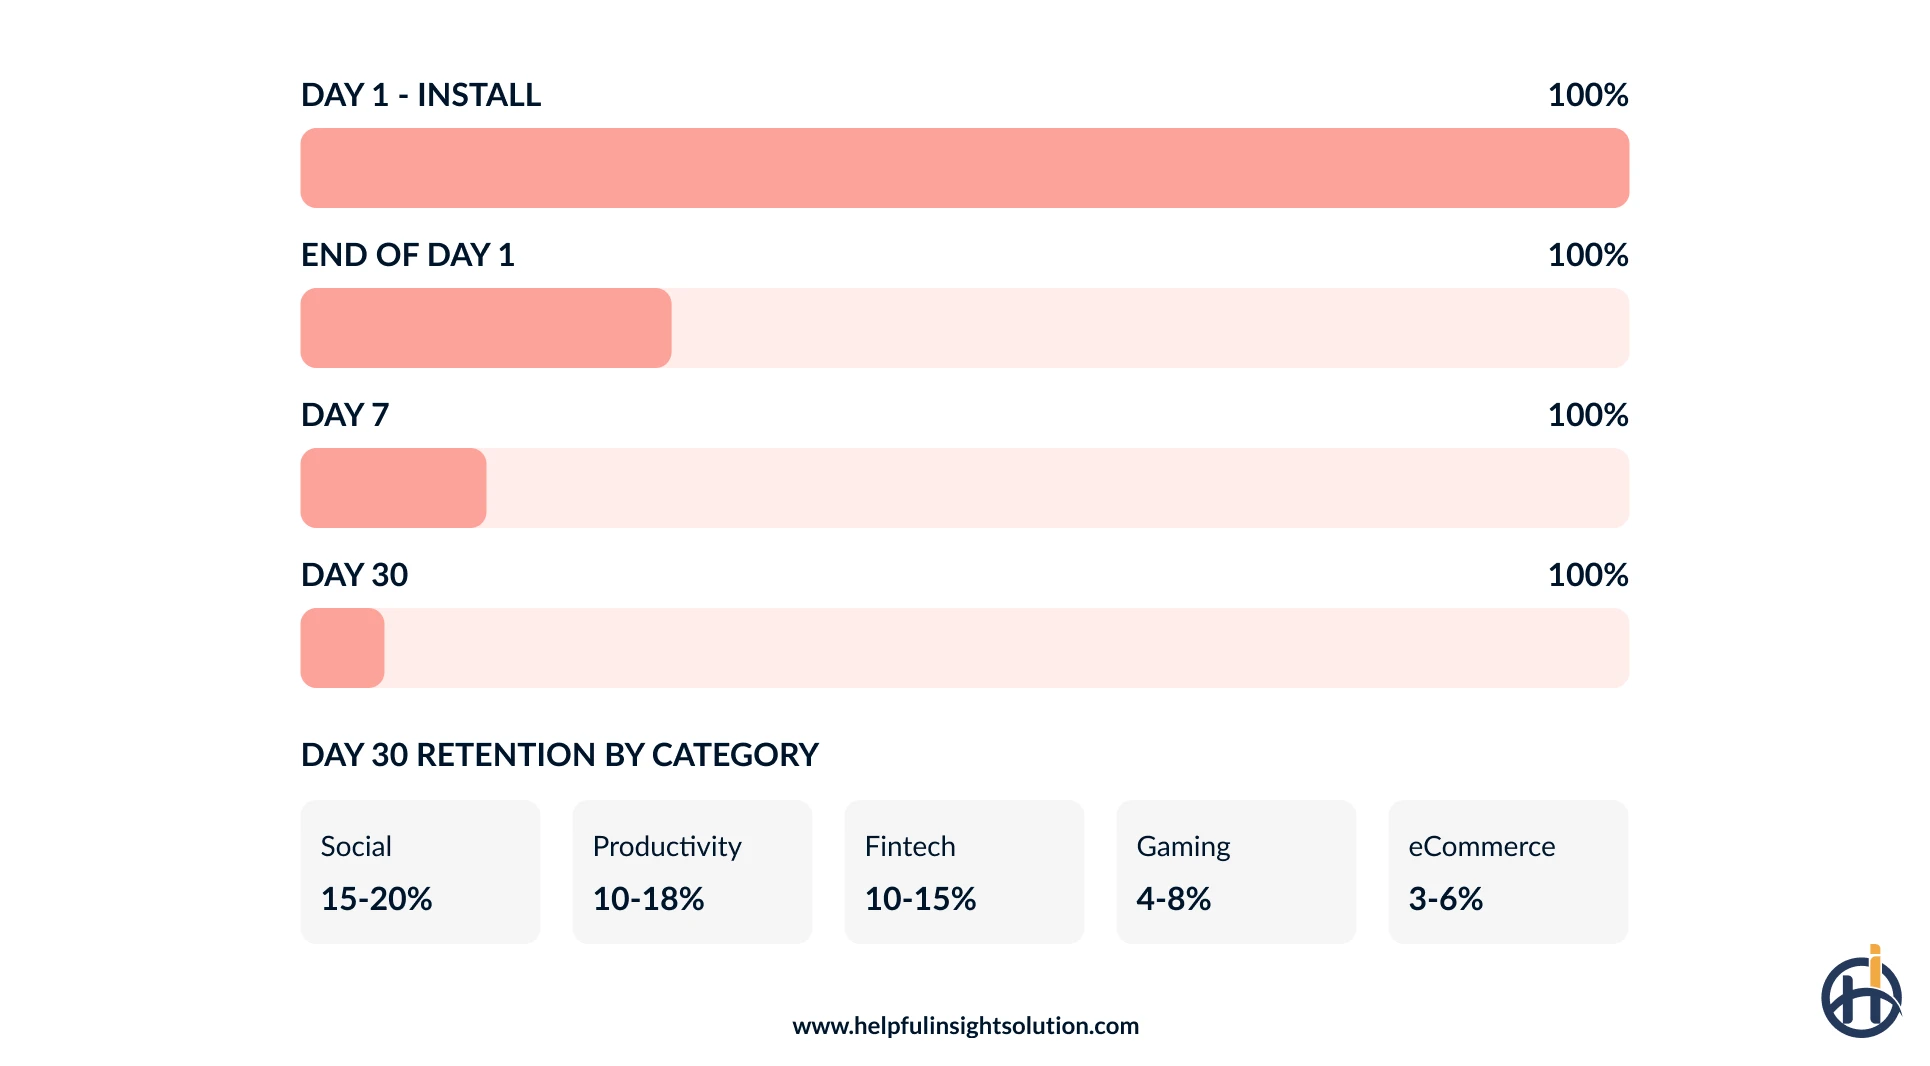
Across all categories, the average app retains around 25% of users on Day 1, about 11% by Day 7, and roughly 6% by Day 30. (Source: Business of Apps via Shno)
These mobile app success rates statistics are an obvious sign that you should invest in an app that can hold the users, beyond attracting them with features.
Mobile App Retention Rate by Category
Retention is the most obvious metric of whether an app delivers real value, and it drops sharply over the first month. The table below shows approximate Day 30 retention by category.
| Category | Approx. Day 30 retention |
| Productivity | 10–18% |
| Social | 15–20% (strong performers) |
| Fintech | 10–15% |
| Gaming | 4–8% |
| eCommerce | 3–6% |
| All-category median | ~4% |
Source: AppsFlyer / UXCam benchmarks, 2026
Finance and productivity apps retain users far better than the norm because people rely on them daily, while eCommerce and casual gaming apps tend to lose users faster. For a fintech mobile app development project, this means strong retention is achievable when the app earns a place in a daily routine.
Mobile App Statistics by Industry
App performance varies enormously by category, so the numbers that matter to you depend on what you are building.
Fintech App Statistics
Fintech is one of the fastest-growing app categories in the world.
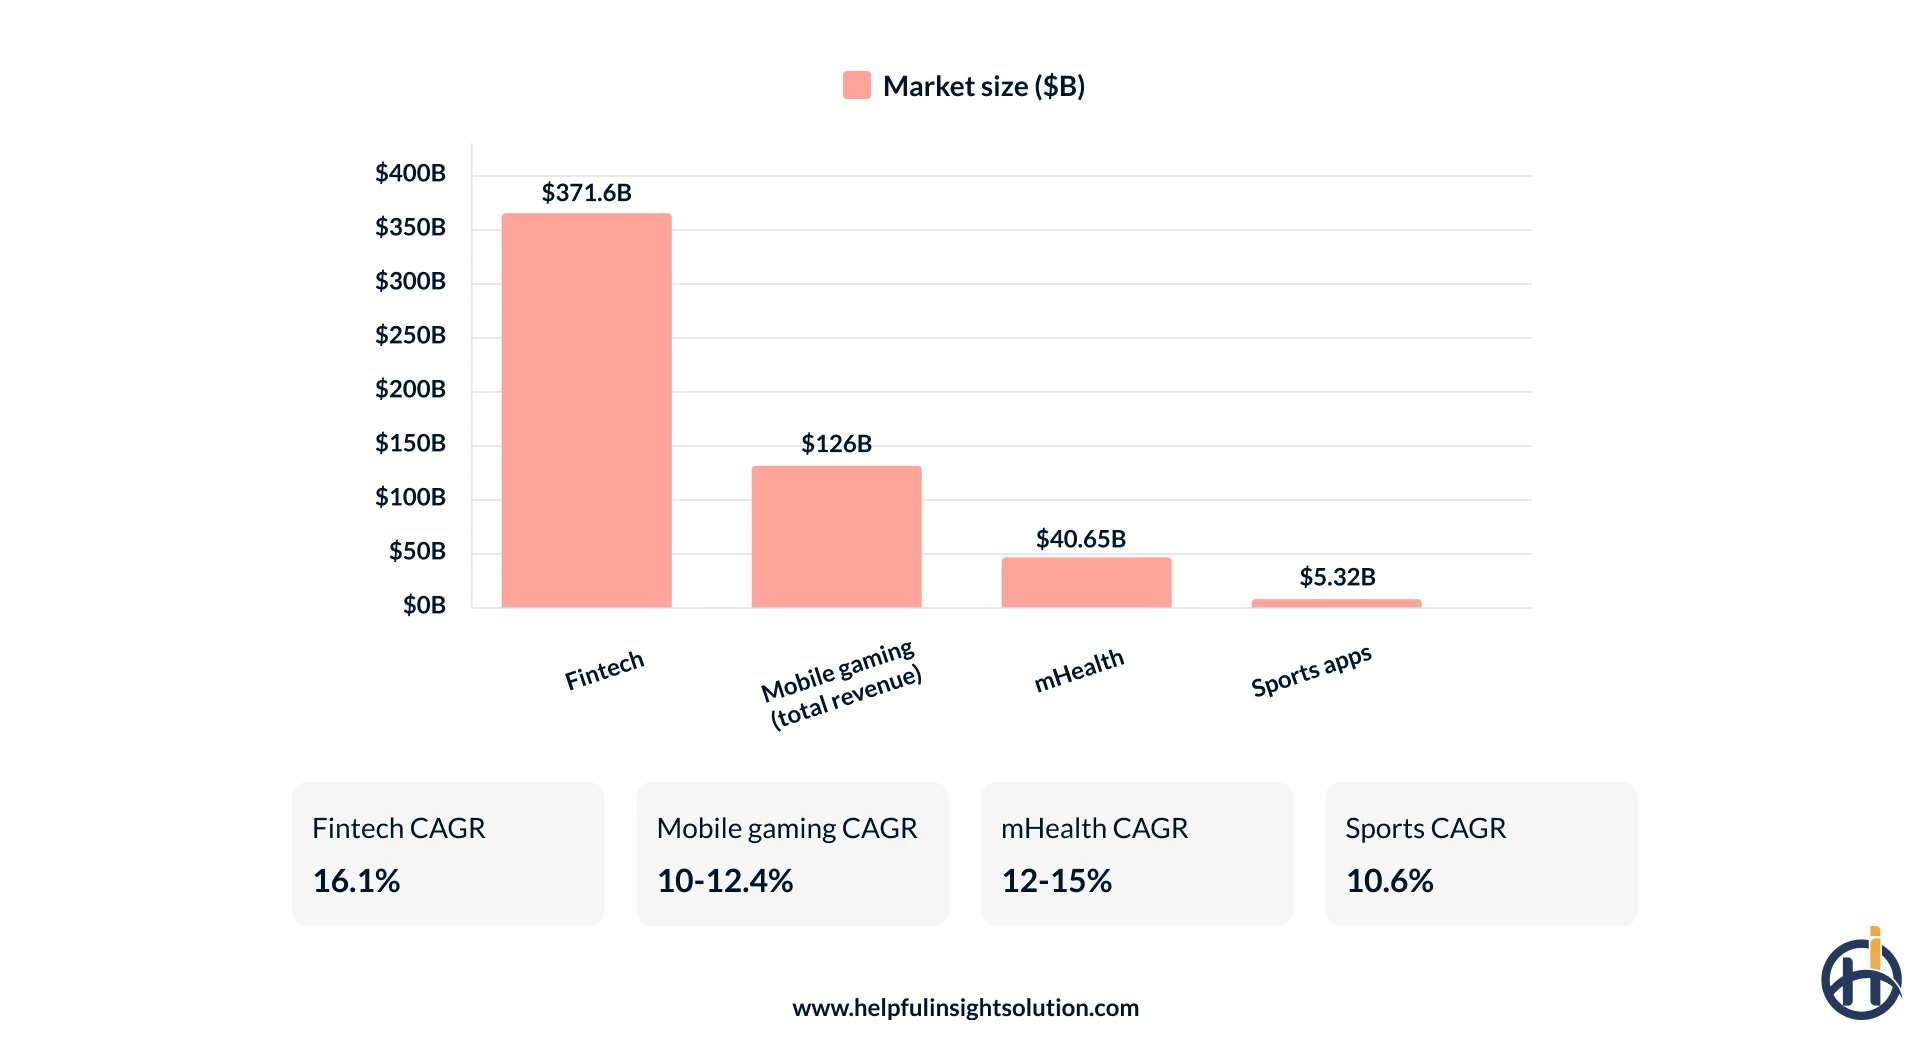
The global fintech app market was estimated at $371.6 billion in 2024, with a CAGR of 16.1%, it is projected to reach approximately $1,026 billion by 2032. (Source: Verified Market Research)
Also, the global fintech user base is increasing, expected to reach around 3.5 billion in 2024 and forecast to climb to 4.45 billion by 2029. (Source: Statista via Omnicalculator)
Adoption is now mainstream, with around 64% of global consumers having actively used a fintech platform, up from just 16% in 2015. (Source: Growthlist)
Insurance App Statistics
Insurance has moved decisively onto mobile, and the apps that power it form a defined and growing market.
The global insurance mobile apps market was valued at around $499 million in 2026 and is projected to reach roughly $638 million by 2035, growing at a CAGR of about 8.5%.
The growth of insurance software and mobile app development is driven by the adoption of these technologies among the policyholders. As of mid 2026, 68% of smartphone users say that they use mobile apps to file claims or update policies. (Source: Global Market Statistics)
Healthcare App Statistics
Healthcare apps, often called mHealth apps, are also among the fastest-growing categories on mobile. The global mHealth apps market was valued at around $40.65 billion in 2025 and is projected to reach roughly $45–46 billion in 2026, growing at a CAGR of around 12% to 15%. (Source: Fortune Business Insights, Mordor Intelligence)
North America leads the world in terms of healthcare app revenue, accounting for 41% of global revenue, followed by Asia Pacific as one of the fastest-growing regions. (Source: Mordor Intelligence)
The growth of healthcare mobile app development is driven by remote patient monitoring, telemedicine, chronic disease management, and the steady pairing of apps with wearable devices.
E-commerce and M-commerce App Statistics
Nowadays, shopping has become a mobile-first activity. The young generation is inclined towards e-commerce and m-commerce.
Mobile commerce is expected to account for around 69.9% of total retail eCommerce sales worth roughly $4.5 trillion. (Source: eMarketer)
Mobile Gaming App Statistics
As discussed earlier, the mobile game applications are among the single largest revenue categories in apps. Mobile games generated around $81.75 billion in in-app purchase revenue in 2025, and total mobile gaming revenue, including advertising, reached an estimated $126 billion, more than console and PC gaming combined. (Sources: Sensor Tower, Newzoo)
If we speak about the number of people who played mobile games in 2025, they are estimated to be around 3 billion people, approximately 83% of all gamers. (Source: Newzoo)
The market has come to the saturation point, and game downloads are falling about about 7.2% to 50.4 billion in 2025 while revenue held steady. (Source: Sensor Tower) So, the mobile app development opportunities lie in retention of live events and smart monetisation rather than chasing raw install numbers.
Sports App Statistics
With fantasy sports driving the sports industry, it has become a million-dollar industry in 2026, and growth is expected to continue in the coming years, too.
The global sports app market was valued at around $5.32 billion in 2025 and is projected to reach roughly $5.34 billion in 2026, on its way to about $13.2 billion by 2034, growing at a CAGR of around 10.6%. North America accounts for 40% of the global sports application market, making it one of the largest markets globally. (Sources: Precedence Research, Fundamental Business Insights)
The unhindered growth of fantasy sports app development is driven by live sports streaming, real-time score tracking, the rise of esports, and the pairing of fitness apps with wearable technology.
GenAI Mobile App Statistics
Since generative AI’s mainstream explosion in 2022, it has been a defining trend for mobile applications across all categories.
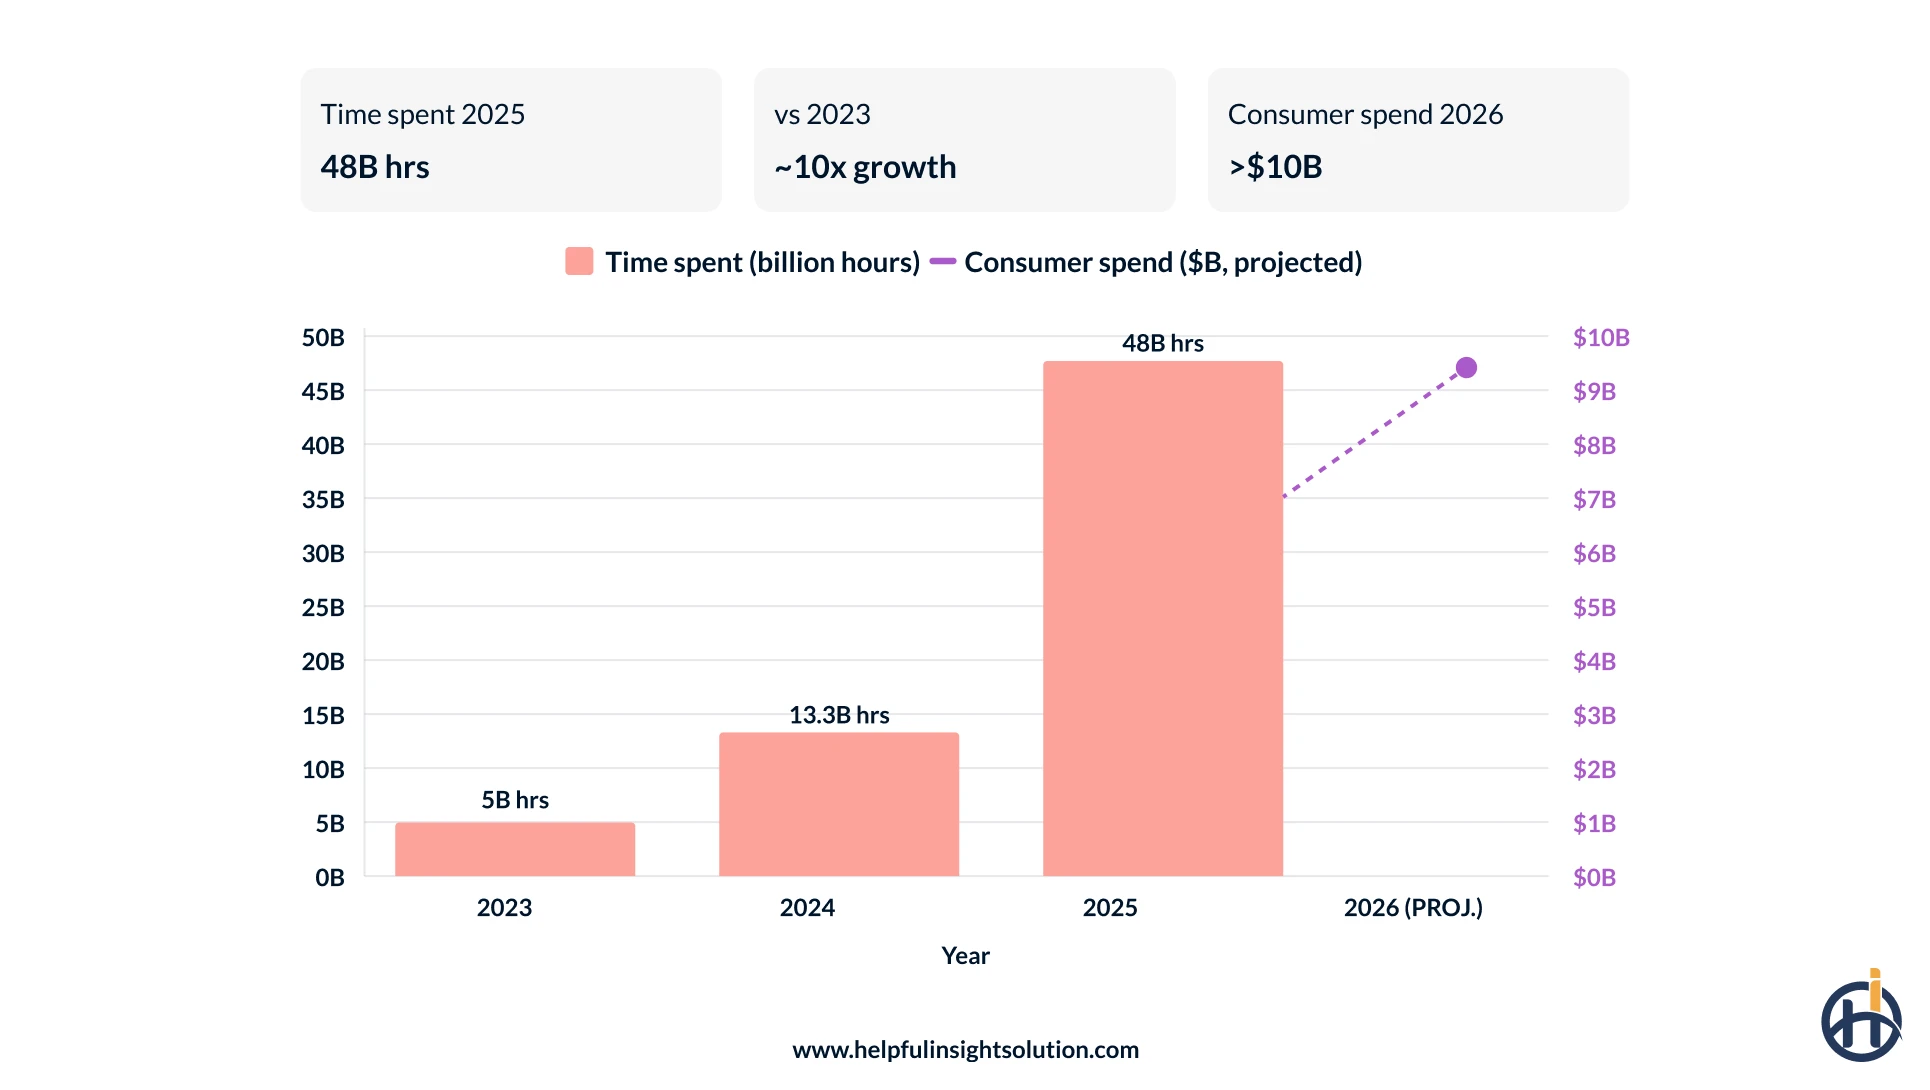
Time spent in generative AI apps reached 48 billion hours in 2025, roughly 3.6 times the 2024 total and nearly ten times the 2023 level. (Source: Sensor Tower)
The adaptation of generative AI shows up across every metric:
- Consumer spending on generative AI apps is projected to exceed $10 billion in 2026, more than double the 2025 level, placing the category among the most lucrative on mobile. (Source: Sensor Tower)
- ChatGPT is forecast to become the single top-earning app worldwide in 2026, after ranking second only to TikTok by in-app revenue in 2025. Source: (Source: Sensor Tower)
- Engagement is now habitual, with ChatGPT users opening the app an average of more than 12 days per month, a stickiness on par with X and Reddit. (Source: Sensor Tower)
According to RevenueCat’s 2026 subscription data, AI-powered apps earn around 41% more revenue per customer but churn roughly 30% faster, so retention is the real challenge in the category. (Source: RevenueCat)
So, the mobile applications seeing success in 2026 and beyond are the ones built around the AI trends now reshaping the category, from agentic assistants to on-device models.
Mobile App Development Trends in 2026
A few clear trends are shaping how apps are built and what users expect in 2026:
- AI is becoming standard, not optional: Around 60% of mobile apps now integrate some form of AI feature, from personalisation to in-app assistants. (Source: Business Research Insights)
- Cross-platform development is the default: A majority of developers now use cross-platform tools to build for iOS and Android at once, cutting cost and time to market.
- Subscriptions and hybrid monetisation are taking over: Recurring revenue models continue to replace one-time purchases as the primary way apps earn.
Future Mobile App Market Forecasts
The long-term outlook for the mobile app market is one of sustained, compounding growth. Multiple research firms project the global market will roughly triple over the next decade:
| Forecast | Source |
| ~$330 billion (2026) → over $1 trillion by 2034, at ~15% CAGR | Fortune Business Insights |
| ~$330 billion (2025) → ~$1.25 trillion by 2035, at ~14.3% CAGR | Precedence Research |
| ~$285 billion (2024) → ~$1.22 trillion by 2035, at ~14.2% CAGR | Spherical Insights |
What do These Mobile App Statistics Mean for Your Business?
Mobile app stats 2026 are the most obvious signs that the market is large, still growing, users spend hours a day inside apps, and the money has shifted from one-off downloads to recurring engagement and spending.
Also, these statistics say that opportunity is global. The USA, the UK, India, and the UAE are expected to lead globally.
This is where we come in. As a leading mobile app development company, Helpful Insights has built apps across fintech, insurance, healthcare, e-commerce, and more for startups, mid-sized businesses, and enterprises. We help you move from market opportunity to a product that launches, performs, and holds its users over time.
If these numbers describe a market you want a place in, let’s talk about the app that gets you there. Share your app idea with us, and we will help you build it into a product that these statistics are describing.